Backlog Visualizations: Tables Are Your Friend
Agile backlogs have become the standard tool used by software teams to document, prioritize, and discuss functionality requests. Although agile backlogs are simple to use and easy to implement, they suffer from the same problem as all lists—growing to a point where they become unmanageable. Although Agile methodologies suggest a number of practices to help control the list (prioritization, regular grooming, etc), extensive lists of items are difficult to manage—especially in fast-moving or complex environments with many considerations. Here’s a quick example of a standard backlog:
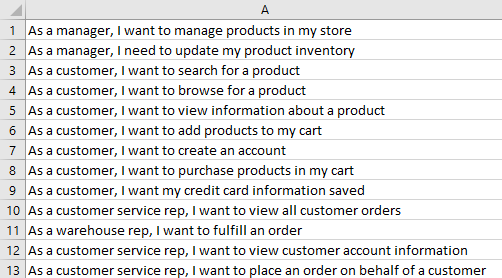
My experience using a backlog reminds me a lot of a family grocery list. The list starts out with one or two items. The list grows as multiple family members add items to it. Over time, items may be duplicated or omitted because of family members’ unfamiliarity with the list. While at the store, shopping can quickly become inefficient if the list isn’t grouped based on the store’s layout. In a best-case scenario, the shopper spends time looking over the entire list while in each aisle. In a worst-case scenario, they end up re-visiting aisles, forgetting items, or leaving without items when time or budget runs out.
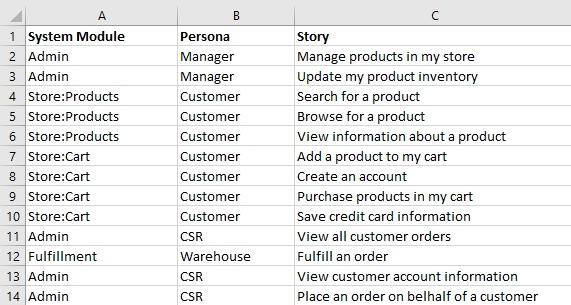
Since product owners and project managers are often experienced Excel users, many will leverage the different columns to make lists more manageable (see image below). They may choose columns for different modules of a program, user classes, or priority level. This allows anyone with knowledge of Excel’s sorts/filters and the structure of the backlog to chop the list into smaller lists for analysis and planning. Although this practice helps make lists more manageable, it still requires the user to have deep knowledge of the backlog to choose meaningful filters.
In today’s dynamic business environment, many stakeholders contribute to the successful development of products. It’s critical that we give them easy access to the backlog. Not all of these users have knowledge of the backlog structure (or the time) to productively comb through the list (or filtered lists) without missing items, making mistakes, or becoming frustrated.
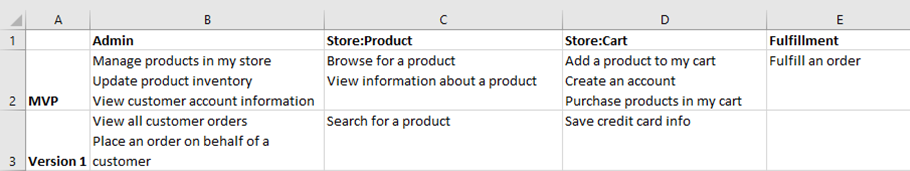
One of the techniques I’ve found very helpful is using a table-based view of the backlog. Depending on the task at hand, different fields can be used for the rows and columns. For example, I want to build consensus among all the stakeholders on our upcoming product roadmap. I may choose to use planned releases for the rows and system modules for the columns (see below). This allows everyone to quickly see the entire product and how it will evolve over upcoming releases.
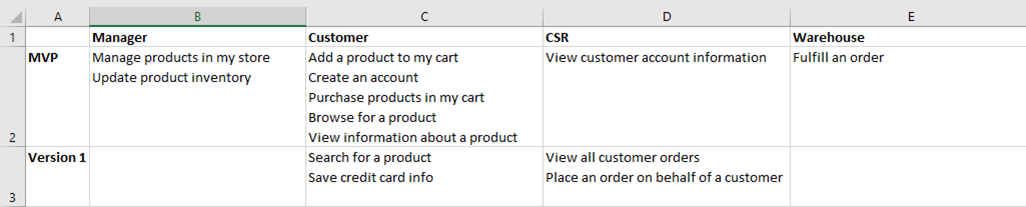
Developing the above plan may first require detailed analysis of the backlog. Let’s say that I have different user personas and I want to make sure we’re delivering some value to every group in each release. To meet this goal, I would choose releases as the rows and user personas as the columns (see below).
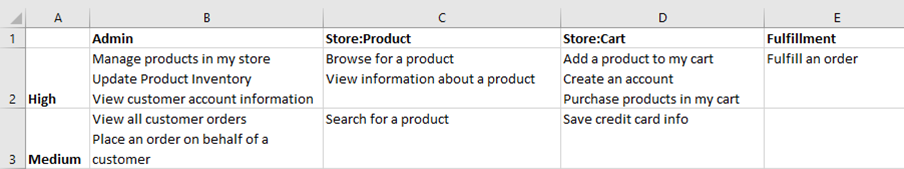
In one final example, let’s say I am trying to plan a release and have a ton of “high” and “medium” priority features to pick from. I can’t include them all, but want to deliver value across my entire platform. In this case, I would find it very helpful to see a table where the rows are priority groups and the columns are system modules.
As you might gather, there are many row/column combinations that could be quite helpful at different points in your product’s or business lifecycle. The best part of this visualization is that it allows the product owner and other stakeholders to take the list and ask different questions of it—hopefully leading to improved decision making, more valuable products, and higher customer satisfaction.
Is there a perfect tool that allows me to visualize a backlog like this? Unfortunately, not that I’ve found. I frequently end up exporting data and using Excel to manually build the tables. But maybe sometime in the future, someone will build a table pivot viewer on top of some of the common backlog management tools.
What other techniques have you found helpful to visualize and manage your team’s backlog?