Developing Reports for SQL Server Reporting Services
A common thread that I’ve noticed in several projects I’ve been on throughout my career is that reports usually come into play at the 11th hour and the engineering team has to draw straws to see who will go “into the unknown” of reporting. I think part of this is just the nature of an engineer’s mind where we care more about how we collect, store, and present data, rather than trying to figure out what the data means. Another cause for this may be the fact that while we are professional developers, we may not be professionals in the industry our products are targeting and we just don’t know exactly what metrics our clients want to get out of our software.
The irony here is that it only takes only a few sales calls, demos, or beta installations with clients (under strict supervision of sales and management staff) to realize that the person who decides whether or not to buy your software probably cares more about reports than anything else.
With all that said, there are several options out there to help you provide reporting to your clients. All of them have their pros and cons. So if, after doing your research, your team has decided to go with SSRS (SQL Server Reporting Services), read on where I (with the help of fellow DPL engineer Andy Unterseher) share tips and tricks we’ve learned from being out of the office the day development tasks where handed out.
Right now I envision this as being a three-part series. This post covers what it takes to develop the reports. Following posts will discuss how to securely deploy the reports and then implement them into your code.
Assumptions
Here’s what you’ll need to use SSRS to develop reports:
- SQL Server Express R2 SP1 or greater installed with SSRS and Business Intelligence Design Studio
- Basic SQL knowledge
- Basic C# knowledge
- You couldn’t talk anyone else into doing reports
Developing Reports
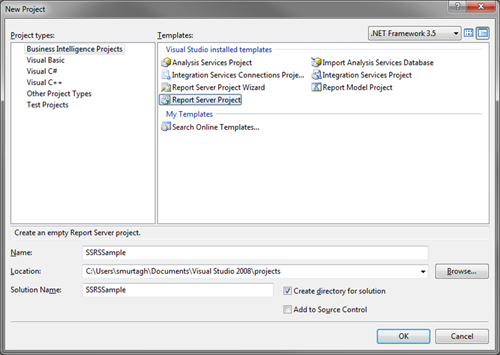
Let’s start by creating a new project. As of now, Visual Studio 2010 does not support report projects so you have to use Visual Studio 2008 or Business Intelligence Design Studio (BIDS), which is pretty much a light-weight version of VS2008. If you need to bind your reports project to TFS2010 within VS2008, I found this article helpful in getting it set up. Make sure to have the latest VS2008 Service Pack installed to ensure the compatibility updates install correctly.
After launching BIDS, create a new Report Server Project.
Before we start creating reports, it’s a good idea to create a Shared Data Source. A Data Source contains the connection settings to your database, along with credentials and authentication methods. A Shared Data Source at the project level allows you to share the same connection to the database across multiple reports within the same project. If your application runs on a single database, chances are you will only need just one Shared Data Source.
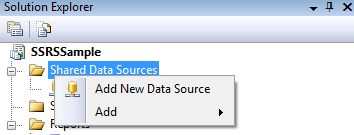
In the Solution Explorer, right-click on the Shared Data Sources folder and select Add New Data Source.
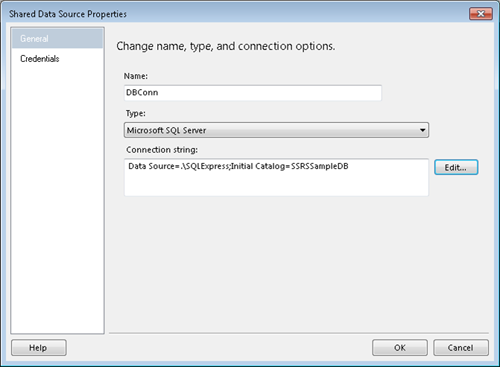
On the General tab, select your database Type and enter your Connection string. If you are like me and can never remember how to build a connection string, the Edit button gives you a nice dialog where you can enter the different parameters and the connection string is built for you.
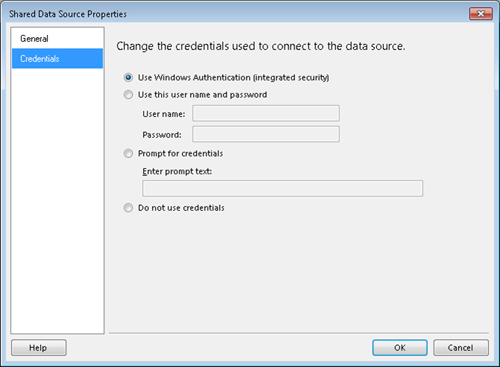
On the Credentials tab, feel free to select Use Windows Authentication to avoid unnecessary interruptions while developing reports. We will cover how to secure the database connection for a production environment in the Deployment section.
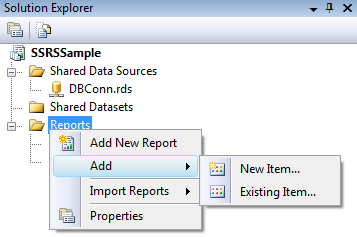
Once we have a Shared Data Source, we can add a report to the project. Right-click on the Solution Explorer’s Reports folder and select Add and New Item…. Don’t use the Add New Report option unless you absolutely love wizards.
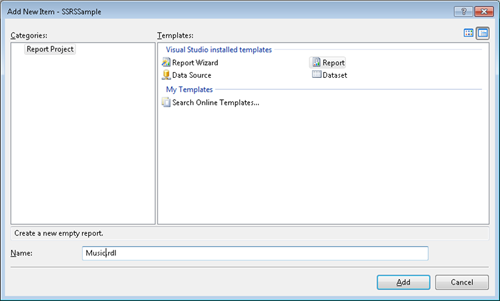
In the Add New Item box, select Report, enter a name for the report (e.g., Music.rdl), and click Add.
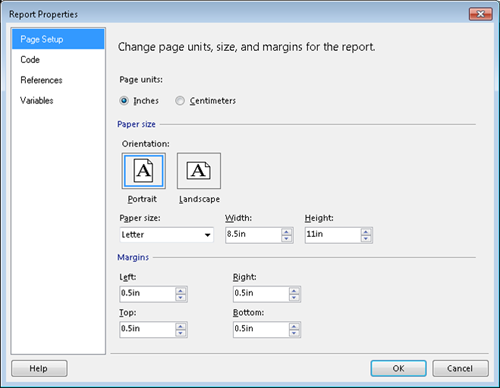
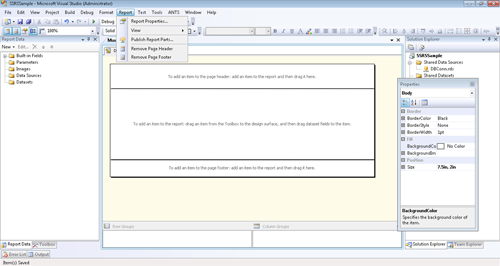
Before we start adding content to the report, it is a good idea to come up with standards for all the reports that your application will use. Decide on a page size, margin size, orientation, header and footer size, etc. Since SSRS does not provide any kind of CSS, a change to any of these report properties can become a very tedious process. For us, the 8.5″ x 11″ paper size with 0.5″ in margins has worked well. Go to the Report menu and select Report Properties… to set these values.
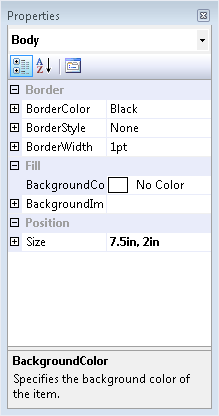
After configuring the Report Settings, we have to set the Report Body properties to make sure we don’t extend content beyond the desired page size. Have a Report Body (plus margins) width greater than the page with usually leads to “phantom” blank pages being rendered on the report at runtime. As far as Report Body height, it’s a good idea to keep that as small as possible to avoid more “phantom” pages being added at the bottom of your rendered reports. The body properties can be accessed by clicking on the report and pressing F4 to display the Properties window.
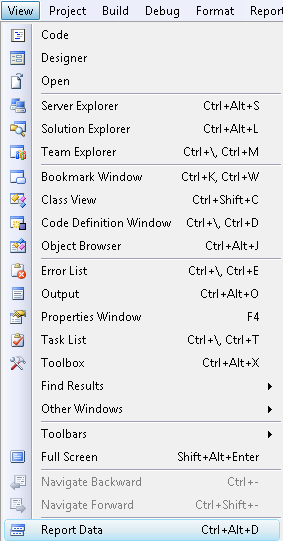
Now it’s time to add some content to the report. If the Report Data and Toolbox windows are not visible, you have to click on the report body before the option becomes available in the View menu. I’ve seen a lot of people waste several minutes just looking for this menu.
After adding a header and footer via the Report menu, we can drag and drop items from the Toolbox and onto the report in a similar way as it is done in Win Forms. Just about any property of any report element can be hard-coded or tied to an expression. An expression allows us to set content, size, color, visibility and other properties at run time. The syntax for expression reminds me of VB and Excel formulas.
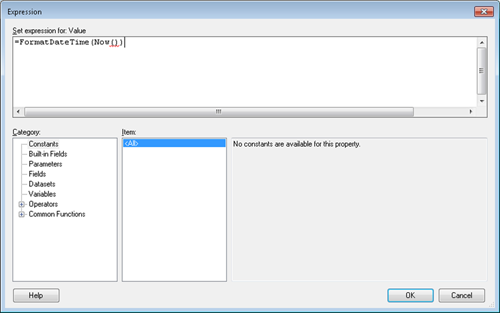
The expressions below show us how to include a time stamp text box and a page counter on the report footer.
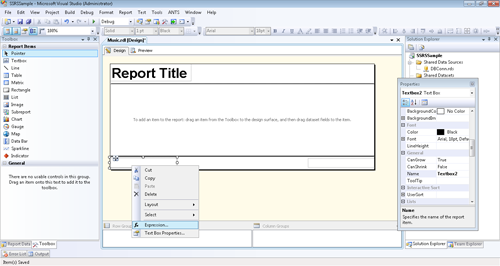
Draw a box where you want to place the time stamp. Right-click in the box and select Expression….
Enter ‘=FormatDateTime(Now())’.
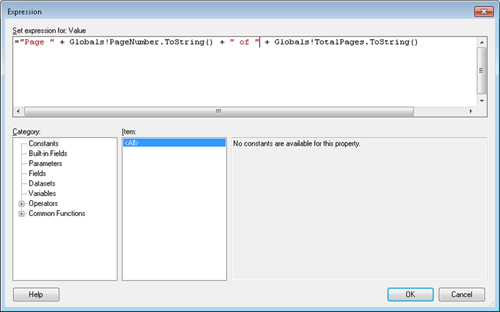
To create a page counter, add a new Textbox to the Report and set the following value on its Expression window:
‘=”Page “ + Globals!PageNumber.ToString() + “ of “ + Globals!TotalPages.ToString()’
One thing that worked well during our implementation was creating a “template report” with our page settings, headers, and footers already set so we didn’t have to go through the above steps every time we added a new report.
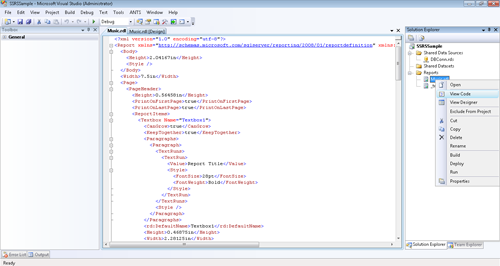
The way we accomplished this was to add a new report to our project, then right-click on the report where the template was created, select View Code and copy the XML content into the code of the newly created template.rdl.
All that sure seems like a lot of work before you start including any real data into the report, but it is worth it in the long run. Refactoring is not particularly friendly when it comes to developing reports so getting the format right the first time can save you a lot of time.
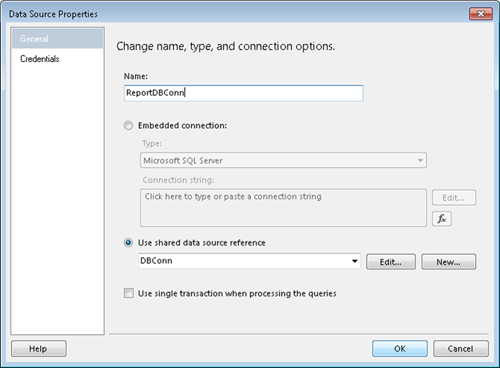
Now we finally get to add some data to the report. First, we have to add a Data Source to the report and link it to the Shared Data Source we created earlier. To add a Data Source to the report, right-click on the Data Sources folder on the Report Data window and select Add Data Source….
Give your Data Source a Name, select the Use shared data source reference option, and pick your Shared Data Source from the drop-down on the Data Source Properties box.
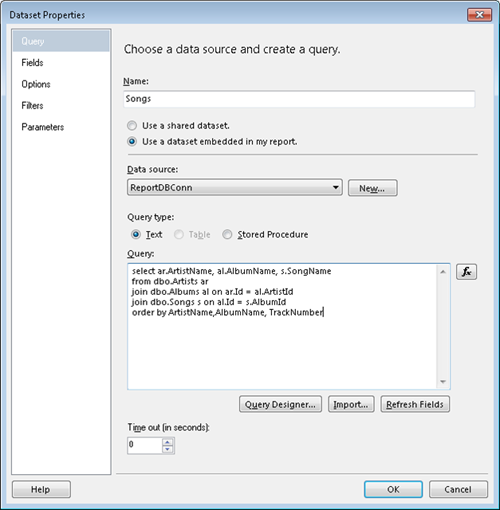
Once we have a Data Source in the report, we can add a dataset which will contain the data displayed on the report. Right-click on the Datasets folder on the Report Data window and select Add Dataset…. On the Dataset Properties box, specify a dataset Name, select a Data source and a Query type.
For this example we will be using a text query but also note that you can call a stored procedure if you prefer. Under Query enter a simple query and click Refresh Fields. Clicking Refresh Field updates the available fields that you can pull into your report, but it also works well as a “query validation” button. If there are any database connection issues or entered an invalid query, clicking Refresh Field will give you an error.
Now that we have a dataset on our report, we can use a table to display the results from its query. Drag a table object from the Toolbox onto the report’s body. Once we have a table on the report, expand the dataset columns and drag the columns from the dataset into the columns on the table.
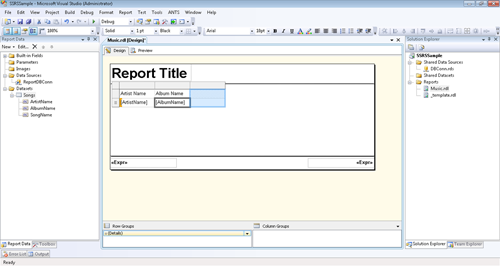
Table properties such as fonts, colors, alignment, etc. can be set at each individual cell or you can apply them to multiple cells by clicking in the row headers, column headers, or the top left of the table object.
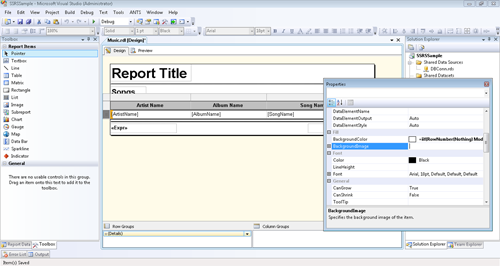
If you want to set conditional properties, such as odd/even row color, you can use an expression with the iif function where iif([condition], [return this value if condition == true],[return this value if condition == false).
To set odd/even colors you can use the following expression:
=iif(RowNumber(Nothing) Mod 2, “LightGrey”, “White”)
Before going too much further, let’s attempt to run this report to make sure everything we’ve done so far looks good. Right-click on your project file and select Properties. In the Property Pages box, expand Debug and select StartItem.
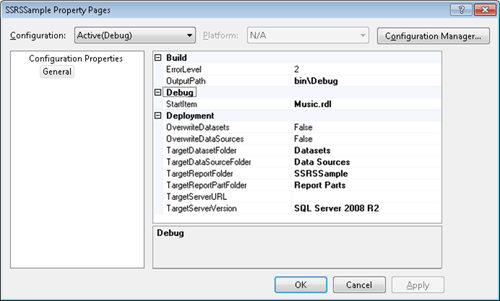
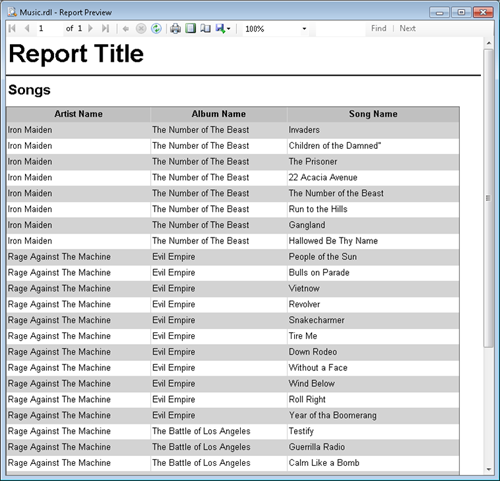
Once that is set, click Debug on the toolbar and your report should render on the Report Preview viewer.
One thing to note is that the content of the report usually gets cached so while debugging it is important to right-click on the project and select Clean then Build, and Debug (Rebuild hasn’t been incredibly reliable for us). Many of us have scratched our heads for hours because we couldn’t figure out why our changes where not taking effect. Also note that the database data also gets cached on the project folder in *.DATA files. If the content of the report is not what you expect, delete *.DATA files from your report project folder.
If you prefer to debug on the fly, you can use the Preview tab on each report, which is a bit quicker and does not require for you to clean and rebuild every time you make a change. However, the data caching quirk still applies here.
Now let’s add some parameters to our report. A parameter is a variable field that can be passed into the report from values entered by the user or by the application implementing the report. A parameter can then be displayed on report objects or used as part of dataset queries and stored procedures.
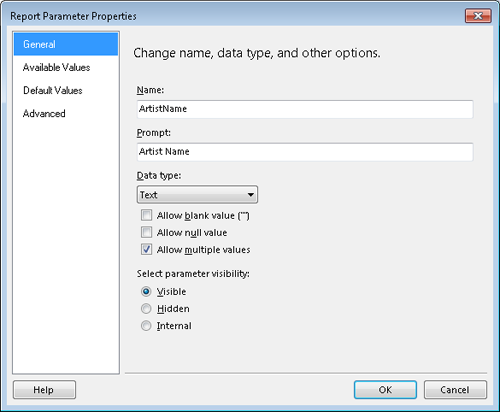
To add a Parameter to a report, simply right-click on the Parameters folder in the Report Data window and select Add Parameter…. Now enter the Name (how you will reference the parameter within the report), a Prompt (a label to prompt the user for a value), Data type, and parameter visibility. A Visible parameter will be visible to the end user via the Report Viewer and they will be able to change the Parameter value. A Hidden parameter is not visible to the user and can come in handy when passing in record IDs, report titles, etc. Internal parameters are similar to Hidden parameters with the only difference being that Internal parameters cannot be changed. Think of an Internal parameter being similar to a constant.
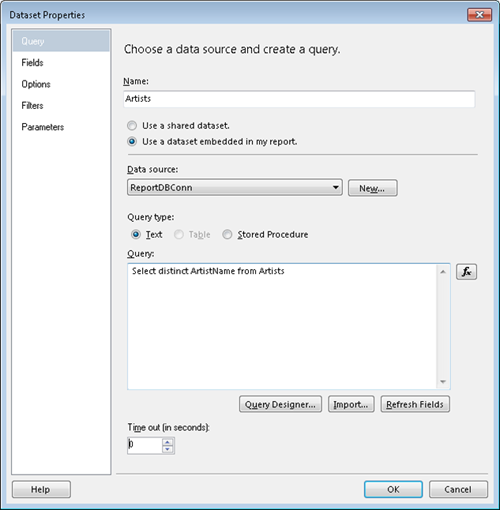
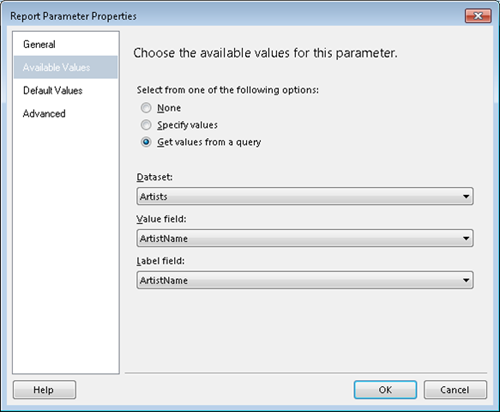
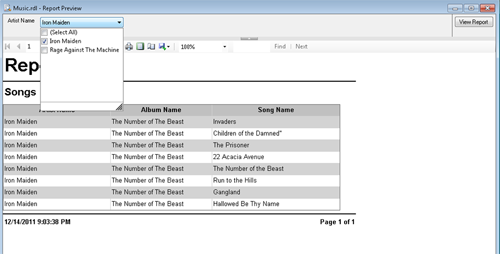
In our example, we could just prompt the user for an artist name and let them type it in, but to avoid issues such as typos and case sensitivity, we can provide a list of available values for the user to pick from. Simply create a new dataset that will contain the available values and bind it to the parameter in the Available Values section of the Parameters Properties box.
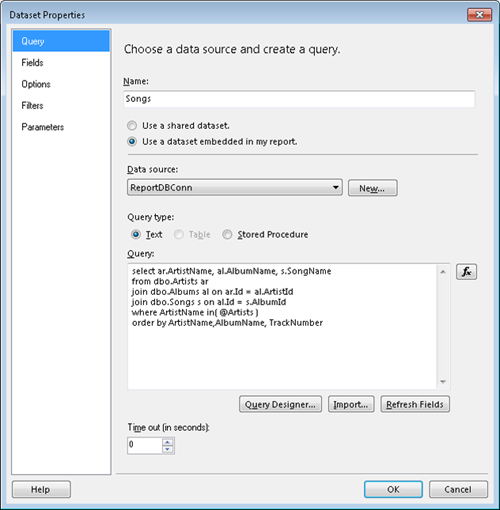
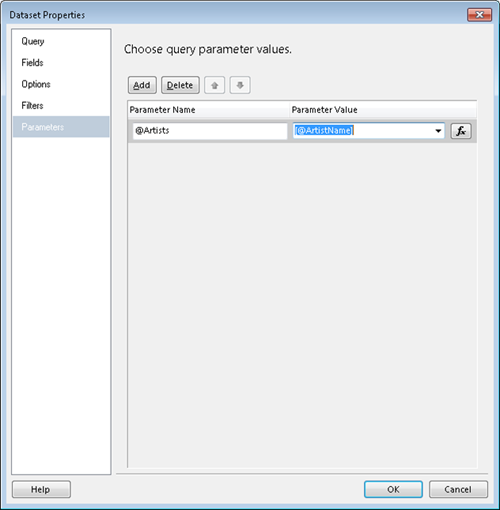
Once the parameters are created, remember to update the corresponding datasets by adding a “where” clause to queries and binding the query parameters to the report parameters on the Parameters section of the Dataset Properties box.
Now clean, rebuild, and debug your report to see the user prompt in action.
Stay tuned. Upcoming posts will cover how to deploy the reports and then implement them into your code.